Camila's Map Catolog
Sunday, December 5, 2010
Correlation Matrix
http://www.google.com.pe/imgres?imgurl=http://www.image.ucar.edu/GSP/Projects/JunIPCCModelBiasCorrelations.jpg&imgrefurl=http://www.image.ucar.edu/GSP/Projects/ResearchNuggets.shtml&usg=__sl91IxoAOETxOezdmOKOwILNTYU=&h=504&w=503&sz=279&hl=es&start=10&zoom=1&um=1&itbs=1&tbnid=e9Jxv4ZDW7jWlM:&tbnh=130&tbnw=130&prev=/images%3Fq%3Dcorrelation%2Bmatrix%26um%3D1%26hl%3Des%26sa%3DN%26ndsp%3D20%26tbs%3Disch:1
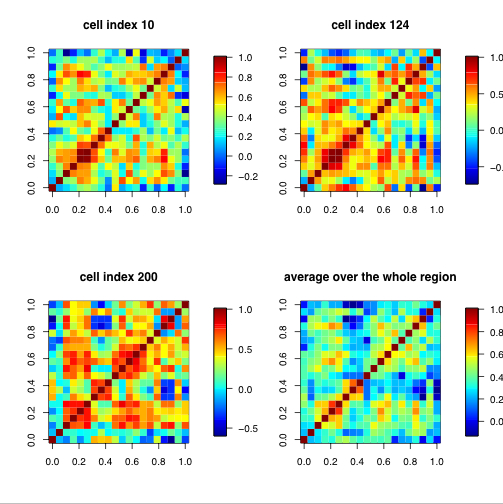
The map above is a correlation matrix and these types of maps depict how well things correlate. In these specific maps the data shown illustrates climate model biases.
No comments:
Post a Comment
Newer Post
Older Post
Home
Subscribe to:
Post Comments (Atom)
No comments:
Post a Comment